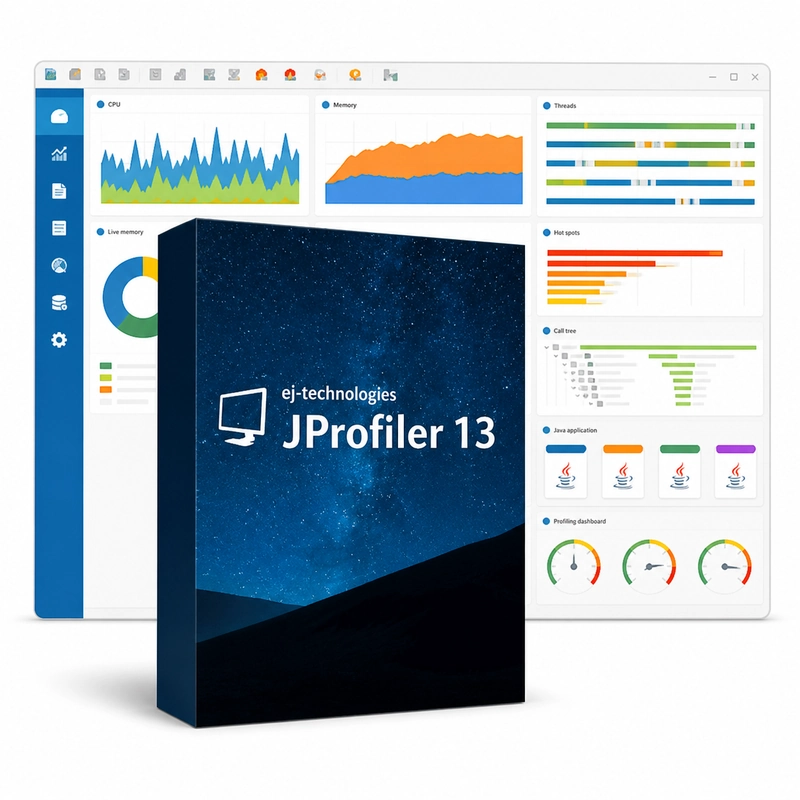
ej-technologies JProfiler 13
In stock
Sold by Get it Cheap, LLC · Is this legit?
- Key in your accountDelivered automatically once payment is confirmed.
- Setup guideStep-by-step installation and activation, next to your key.
- Won’t activate?Report it within 14 days and we replace or refund it · Refund Policy
Overview
Locate Java performance bottlenecks and memory issues with profiling data. ej-technologies JProfiler 13 is a Java profiler. It records CPU hot spots and call trees, inspects the heap to find memory leaks and the objects that keep them alive, shows threads, locks and deadlocks, and profiles higher-level events such as JDBC queries, JPA, HTTP calls and sockets. It attaches to local or remote JVMs and integrates with IDEs. A profiling session connects the tool to a Java workload and records the type of activity you want to investigate. CPU views help identify methods consuming time, while memory views help examine allocations and retained objects. Thread information adds context when a slowdown is related to waiting or competing work rather than raw computation. The value comes from connecting a symptom to an observable code path. Reproduce the operation that is slow, collect the relevant measurements and compare the result after a change. This supports targeted optimization instead of changing code based only on assumptions about where time or memory is being spent. A profiler needs access to the target JVM and an appropriate agent configuration. Results depend on the workload and recording settings, so a short synthetic run may not represent production behavior. Verify version 13 compatibility with the actual JVM and environment, and plan profiling overhead when investigating a live service.
Features
- CPU call trees and hot spots
- Heap walker for memory leaks
- Thread and lock analysis
- JDBC, JPA and HTTP probes
- IDE integration and remote profiling
Specs
- Platform
- Cross-platform
- License type
- Retail
- Devices
- 1 Device
- Region restrictions
- Global
- Activation
- Product key
- Duration
- Lifetime
Global means we sell this key without a region lock. The publisher can still restrict use in some countries under its own terms.
Lifetime means the license does not expire. It does not mean the publisher still updates or supports this version — that can end earlier.